Dynamic Application Scaling Using Kubernetes Event-Driven Autoscaling


KEDA?
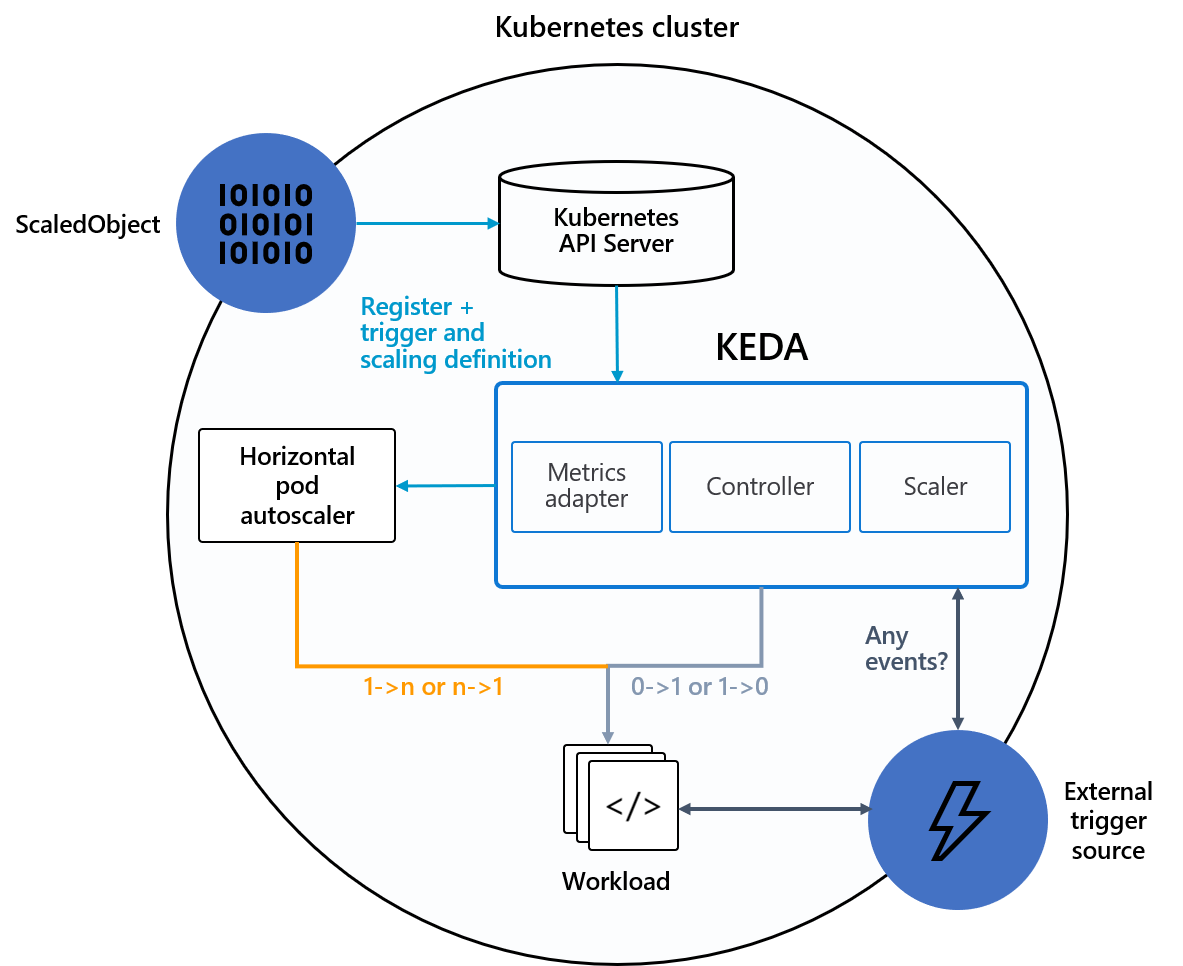
KEDA (Kubernetes Event-Driven Autoscaling) is a Kubernetes-based Event Driven Autoscaler. With KEDA, you can scale any container in Kubernetes based on the number of events that need processing. (KEDA official page)
Why do we need KEDA?
Kubernetes gives us a built-in way to handle horizontal scaling. The tool that lets us do this is called the Horizontal Pod Autoscaler (HPA).
However, HPA is quite basic, as it only scales workloads based on CPU and RAM usage, which isn’t always enough!
Although HPA can be set up to use custom metrics, it's not quick or easy to configure.
That's why we need something more – a solution that can scale workloads based on information from any source, such as:
Monitoring systems
Queue systems
Cloud resources
KEDA allows us to do this and to have a horizontal scaling system with no limits, scaling your application easily and efficiently!
Check the KEDA official page to see all the event source that supports!
Let’s try it now!
Step 1: Prometheus
Let’s start by deploying Prometheus to use it as our data source for autoscaling. Prometheus is a powerful monitoring and alerting toolkit that is widely used in the Kubernetes ecosystem. We will use the kube-prometheus stack, which provides a complete monitoring solution for Kubernetes clusters. This stack includes Prometheus, Alertmanager, and Grafana, along with various exporters to collect metrics from the Kubernetes components.
First, we need to install the kube-prometheus stack. This can be done using Helm, a package manager for Kubernetes. Ensure that you have Helm installed and configured on your cluster. Then, add the Prometheus community Helm repository:
helm repo add prometheus-community https://prometheus-community.github.io/helm-charts
helm repo update
Next, install the kube-prometheus stack using the following command:
helm install kube-prometheus-stack prometheus-community/kube-prometheus-stack --namespace monitoring --create-namespace
This command will deploy Prometheus, Alertmanager, and Grafana into the monitoring namespace. It will also set up various exporters to collect metrics from the Kubernetes API server, kubelets, and other components.
KEDA should scale our application based on the metrics collected by Prometheus.
Run terraform apply and check that workloads is running as expected:
> k get all -n kube-prometheus-stack
NAME                                                         READY   STATUS    RESTARTS        AGE
pod/lupass-prometheus-node-exporter-hr24t                    1/1     Running   5 (140m ago)    7d16h
pod/alertmanager-lupass-kube-prometheus-sta-alertmanager-0   2/2     Running   8 (140m ago)    7d16h
pod/lupass-grafana-7b9744f967-85n66                          3/3     Running   12 (140m ago)   7d16h
pod/prometheus-lupass-kube-prometheus-sta-prometheus-0       2/2     Running   8 (140m ago)    7d16h
pod/lupass-kube-state-metrics-7846ddf98b-vtgc9               1/1     Running   8 (139m ago)    7d16h
pod/lupass-kube-prometheus-sta-operator-f4cc44cbb-7z7fr      1/1     Running   8 (139m ago)    7d16h

NAME                                              TYPE           CLUSTER-IP      EXTERNAL-IP    PORT(S)                      AGE
service/lupass-grafana                            ClusterIP      10.43.152.9     <none>         80/TCP                       7d16h
service/lupass-kube-state-metrics                 ClusterIP      10.43.192.213   <none>         8080/TCP                     7d16h
service/lupass-kube-prometheus-sta-alertmanager   ClusterIP      10.43.56.188    <none>         9093/TCP                     7d16h
service/lupass-kube-prometheus-sta-operator       ClusterIP      10.43.226.111   <none>         443/TCP                      7d16h
service/lupass-prometheus-node-exporter           ClusterIP      10.43.126.7     <none>         9100/TCP                     7d16h
service/alertmanager-operated                     ClusterIP      None            <none>         9093/TCP,9094/TCP,9094/UDP   7d16h
service/prometheus-operated                       ClusterIP      None            <none>         9090/TCP                     7d16h
service/lupass-kube-prometheus-sta-prometheus     LoadBalancer   10.43.178.116   172.24.87.51   9090:30881/TCP               7d16h

NAME                                             DESIRED   CURRENT   READY   UP-TO-DATE   AVAILABLE   NODE SELECTOR            AGE
daemonset.apps/lupass-prometheus-node-exporter   1         1         1       1            1           kubernetes.io/os=linux   7d16h

NAME                                                  READY   UP-TO-DATE   AVAILABLE   AGE
deployment.apps/lupass-grafana                        1/1     1            1           7d16h
deployment.apps/lupass-kube-state-metrics             1/1     1            1           7d16h
deployment.apps/lupass-kube-prometheus-sta-operator   1/1     1            1           7d16h

NAME                                                            DESIRED   CURRENT   READY   AGE
replicaset.apps/lupass-grafana-7b9744f967                       1         1         1       7d16h
replicaset.apps/lupass-kube-state-metrics-7846ddf98b            1         1         1       7d16h
replicaset.apps/lupass-kube-prometheus-sta-operator-f4cc44cbb   1         1         1       7d16h

NAME                                                                    READY   AGE
statefulset.apps/alertmanager-lupass-kube-prometheus-sta-alertmanager   1/1     7d16h
statefulset.apps/prometheus-lupass-kube-prometheus-sta-prometheus       1/1     7d16h
Step 2: Traefik Ingress Controller
resource "helm_release" "traefik" {

  name       = "lupass"
  repository = "https://traefik.github.io/charts"
  chart      = "traefik"
  version    = "23.1.0"
  namespace  = "ingress"
  create_namespace = true
  values = [
    <<EOF
    ports:
      web:
        exposedPort: 8080
      websecure:
        exposedPort: 8443
    metrics:
      prometheus:
        service:
          enabled: true
        serviceMonitor:
          enabled: true
        addServicesLabels: true
    EOF
  ]
}
Run terraform apply and check that all is running as expected:
> k get all -n ingress
NAME                                 READY   STATUS    RESTARTS        AGE
pod/lupass-traefik-78c596fbd-hzw7b   1/1     Running   3 (4h16m ago)   2d21h

NAME                             TYPE           CLUSTER-IP      EXTERNAL-IP    PORT(S)                         AGE
service/lupass-traefik-metrics   ClusterIP      10.43.18.114    <none>         9100/TCP                        2d21h
service/lupass-traefik           LoadBalancer   10.43.181.236   172.24.87.51   8080:31680/TCP,8443:32307/TCP   2d21h

NAME                             READY   UP-TO-DATE   AVAILABLE   AGE
deployment.apps/lupass-traefik   1/1     1            1           2d21h

NAME                                        DESIRED   CURRENT   READY   AGE
replicaset.apps/lupass-traefik-796ff65c8d   0         0         0       2d21h
replicaset.apps/lupass-traefik-78c596fbd    1         1         1       2d21h
Step 3: KEDA
resource "helm_release" "keda" {
  name       = "lupass"
  repository = "https://kedacore.github.io/charts"
  chart      = "keda"
  version    = "2.10.2"
  namespace  = "keda"
  create_namespace = true
}
Run terraform apply and check that all is running as expected:
> k get all -n keda
NAME                                                  READY   STATUS    RESTARTS        AGE
pod/keda-operator-metrics-apiserver-895f85797-mggsv   1/1     Running   5 (4h25m ago)   7d19h
pod/keda-admission-webhooks-7b8bb94465-vv57b          1/1     Running   6 (4h25m ago)   7d19h
pod/keda-operator-7d866b5f64-s8zb6                    1/1     Running   6 (4h25m ago)   7d19h

NAME                                      TYPE        CLUSTER-IP     EXTERNAL-IP   PORT(S)          AGE
service/keda-admission-webhooks           ClusterIP   10.43.228.69   <none>        443/TCP          7d19h
service/keda-operator                     ClusterIP   10.43.73.78    <none>        9666/TCP         7d19h
service/keda-operator-metrics-apiserver   ClusterIP   10.43.251.89   <none>        443/TCP,80/TCP   7d19h

NAME                                              READY   UP-TO-DATE   AVAILABLE   AGE
deployment.apps/keda-operator-metrics-apiserver   1/1     1            1           7d19h
deployment.apps/keda-admission-webhooks           1/1     1            1           7d19h
deployment.apps/keda-operator                     1/1     1            1           7d19h

NAME                                                        DESIRED   CURRENT   READY   AGE
replicaset.apps/keda-operator-metrics-apiserver-895f85797   1         1         1       7d19h
replicaset.apps/keda-admission-webhooks-7b8bb94465          1         1         1       7d19h
replicaset.apps/keda-operator-7d866b5f64                    1         1         1       7d19h
Step 4: Deploy your application (we use podinfo as example workload) and expose it via Traefik with Ingress Resource:
resource "helm_release" "pod_info" {
  name       = "lupass"
  repository = "https://stefanprodan.github.io/podinfo"
  chart      = "podinfo"
  version    = "6.3.6"
  namespace = "podinfo"
  create_namespace = true
  values = [
    <<EOF
    ingress:
      hosts:
        - paths:
            - path: /
              pathType: Prefix
      enabled: true
      className: lupass-traefik
    EOF
  ]
}
> k get all -n podinfo
NAME                                  READY   STATUS    RESTARTS   AGE
pod/lupass-podinfo-6fbb499f65-cr6p6   1/1     Running   0          4h19m

NAME                     TYPE        CLUSTER-IP      EXTERNAL-IP   PORT(S)             AGE
service/lupass-podinfo   ClusterIP   10.43.123.152   <none>        9898/TCP,9999/TCP   2d4h

NAME                             READY   UP-TO-DATE   AVAILABLE   AGE
deployment.apps/lupass-podinfo   1/1     1            1           2d4h

NAME                                        DESIRED   CURRENT   READY   AGE
replicaset.apps/lupass-podinfo-6fbb499f65   1         1         1       2d4h
> k get ingress -n podinfo
NAME             CLASS            HOSTS   ADDRESS        PORTS   AGE
lupass-podinfo   lupass-traefik   *       172.24.87.51   80      2d4h
Step 5: Deploy ScaledObject
ScaledObject is a CRD from KEDA that allows to specify the target workload that we want to scale and the desired configuration of auto-scaling.
The target metric that we use for scaling purpose is traefik_service_requests_total applied to podinfo service. This is the query that we want to use as trigger of our auto-scaling configuration:
max(irate(traefik_service_requests_total{exported_service="podinfo-lupass-podinfo-9898@kubernetes"}[1m]))
It represents the maximum rate of total number of requests to the podinfo service in the last minute interval.
resource "kubernetes_manifest" "scale_podinfo" {

  manifest = yamldecode(<<EOF
  apiVersion: keda.sh/v1alpha1
  kind: ScaledObject
  metadata:
    name: scale-podinfo
    namespace: podinfo
  spec:
    scaleTargetRef:
      apiVersion: apps/v1
      kind: Deployment
      name: lupass-podinfo
    pollingInterval: 10
    cooldownPeriod: 150
    minReplicaCount: 1
    maxReplicaCount: 8
    triggers:
    - type: prometheus
      metadata:
        serverAddress: http://lupass-kube-prometheus-sta-prometheus.kube-prometheus-stack:9090
        metricName: traefik_service_requests_total
        threshold: "15"
        query: max(irate(traefik_service_requests_total{exported_service="podinfo-lupass-podinfo-9898@kubernetes"}[1m]))

  EOF
  )
}
Deploy its and check.
Under the hood, KEDA acts to monitor the event source and feed that data to Kubernetes and the HPA (Horizontal Pod Autoscaler) to drive rapid scale of a resource. (KEDA)
> k get all -n podinfo
NAME                                  READY   STATUS    RESTARTS   AGE
pod/lupass-podinfo-6fbb499f65-cr6p6   1/1     Running   0          4h19m

NAME                     TYPE        CLUSTER-IP      EXTERNAL-IP   PORT(S)             AGE
service/lupass-podinfo   ClusterIP   10.43.123.152   <none>        9898/TCP,9999/TCP   2d4h

NAME                             READY   UP-TO-DATE   AVAILABLE   AGE
deployment.apps/lupass-podinfo   1/1     1            1           2d4h

NAME                                        DESIRED   CURRENT   READY   AGE
replicaset.apps/lupass-podinfo-6fbb499f65   1         1         1       2d4h

NAME                                                         REFERENCE                   TARGETS      MINPODS   MAXPODS   REPLICAS   AGE
horizontalpodautoscaler.autoscaling/keda-hpa-scale-podinfo   Deployment/lupass-podinfo   0/15 (avg)   1         8         1
Now install locust on the cluster to perform load testing on our target application in order to trigger and test the autoscaling:
resource "kubernetes_namespace" "locust" {
    metadata {
        name = "locust"
    }
}
resource "kubernetes_deployment" "locust" {
    metadata {
        name = "locust"
        namespace = kubernetes_namespace.locust.metadata.0.name
    }

    spec {
        selector {
            match_labels = {
                "app" = "locust"
            }
        }
        template {
            metadata {
                labels = {
                    "app" = "locust"
                }
            }
            spec {
                container {
                    name = "locust"
                    image = "locustio/locust"
                    port {
                        container_port = 8089
                    }
                    volume_mount {
                        mount_path = "/home/locust"
                        name = kubernetes_config_map.locust_script.metadata.0.name
                    }


                }
                volume {
                    name = kubernetes_config_map.locust_script.metadata.0.name
                    config_map {
                        name = kubernetes_config_map.locust_script.metadata.0.name
                    }
                }
            }
        }
    }
}


resource "kubernetes_service" "locust" {
  metadata {
    name = "locust"
    namespace = kubernetes_namespace.locust.metadata.0.name
  }
  spec {
    selector = kubernetes_deployment.locust.spec.0.selector.0.match_labels
    port {
      port        = 8050
      target_port = 8089
    }

    type = "LoadBalancer"
  }

}

resource "kubernetes_config_map" "locust_script" {
  metadata {
    name = "locust-script"
    namespace =  kubernetes_namespace.locust.metadata.0.name
  }

  data = {
    "locustfile.py" = file("${path.root}/locustfile.py")
  }
}
from locust import HttpUser, task
class HelloWorldUser(HttpUser):
    @task
    def hello_world(self):
        self.client.get("/")
> k get all -n locust
NAME                         READY   STATUS    RESTARTS   AGE
pod/locust-7f89d687d-2vqgk   1/1     Running   0          5h27m

NAME             TYPE           CLUSTER-IP    EXTERNAL-IP    PORT(S)          AGE
service/locust   LoadBalancer   10.43.1.220   172.24.87.51   8050:32611/TCP   5h15m

NAME                     READY   UP-TO-DATE   AVAILABLE   AGE
deployment.apps/locust   1/1     1            1           5h27m

NAME                               DESIRED   CURRENT   READY   AGE
replicaset.apps/locust-7f89d687d   1         1         1       5h27m
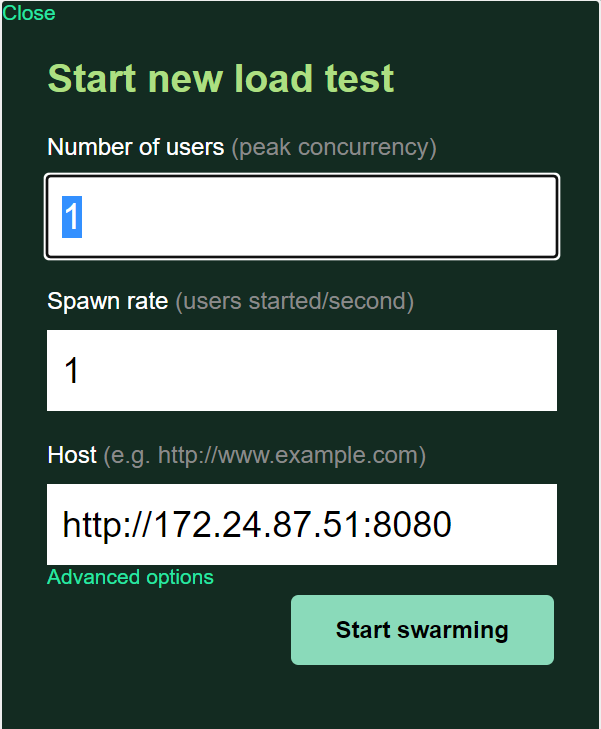
Now, go to locust page and start the load testing:
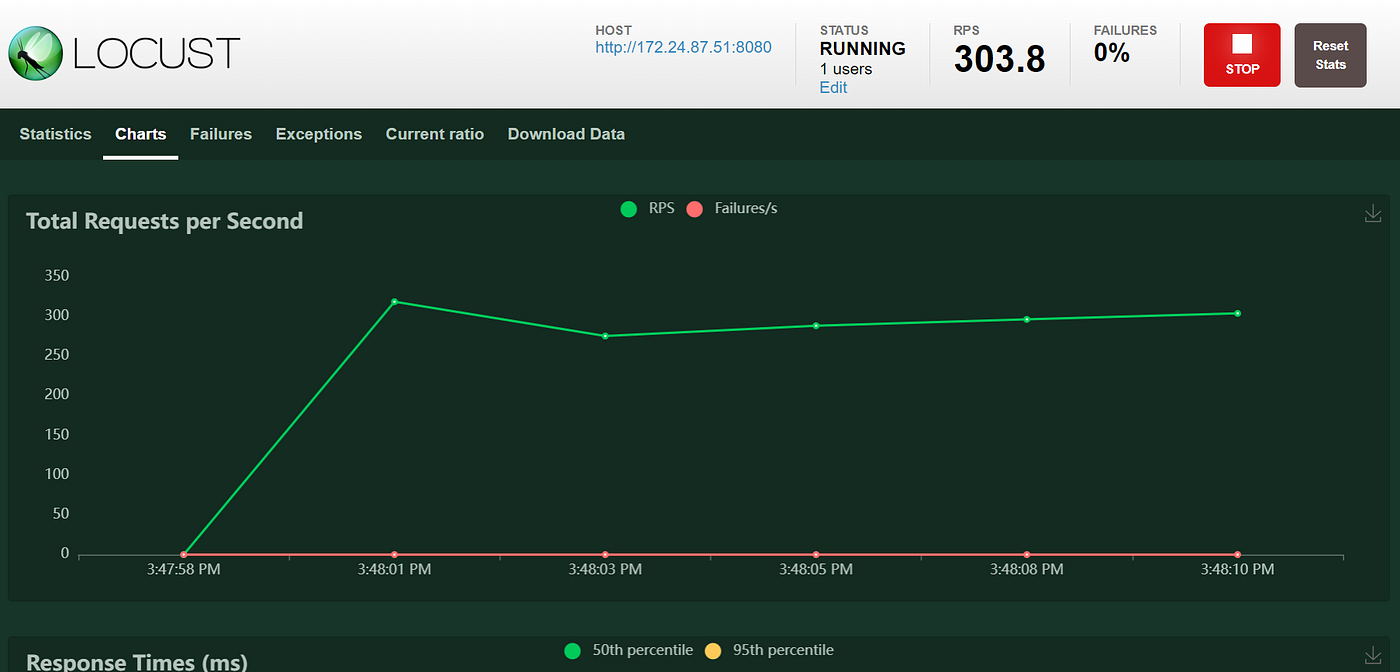
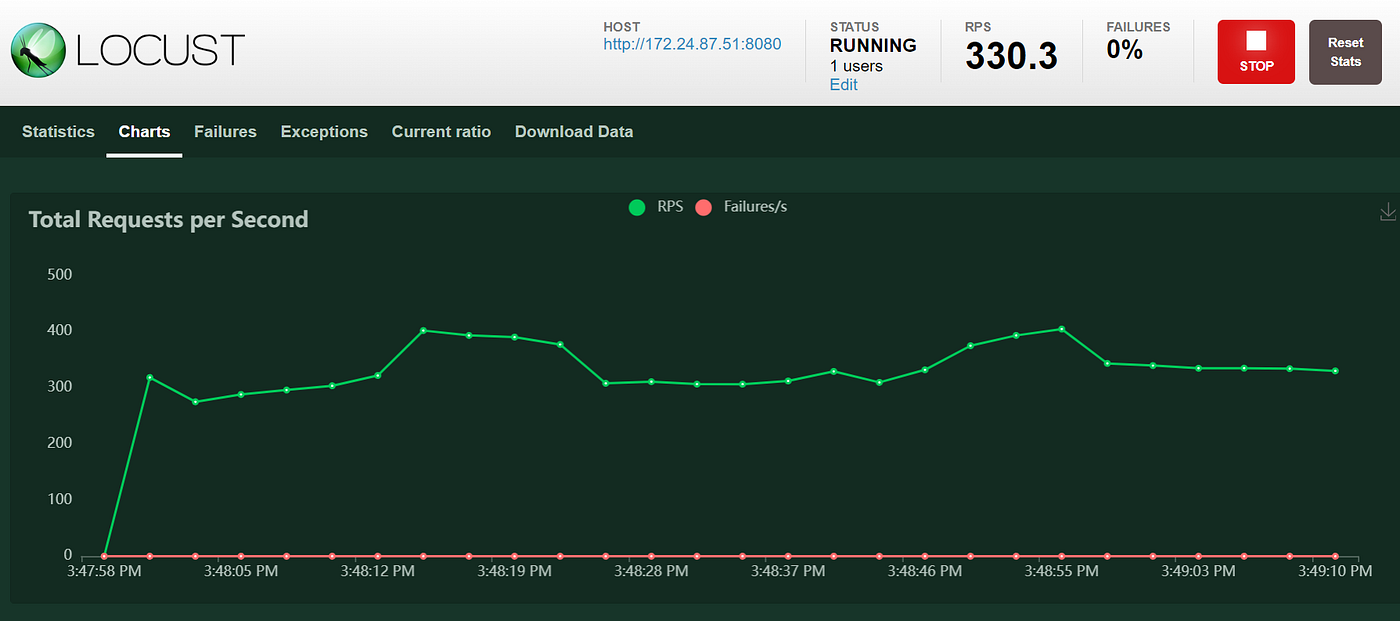
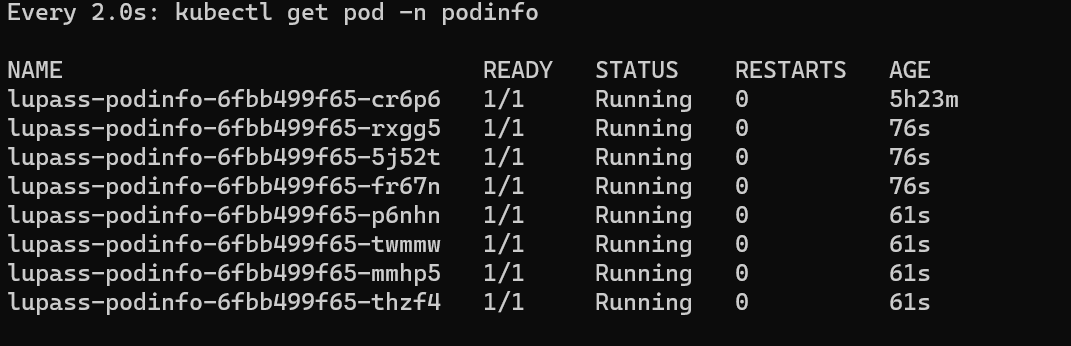
As we can see this trigger the autoscaling of our workloads that thanks to KEDA scale quickly! :
In this way you can scale easly and efficiently your workloads and unlock Kubernetes Power thanks to KEDA Event-Driven Autoscaler!
If you liked this article put a like and leave a comment!